

Executive summary
The Philippine rice harvest grew in 2025 while average net returns per hectare fell. For a farmer weighing a new input, the first question is which field constraint is costing income. The second is whether fixing it pays at harvest.
| Indicator | 2024 | 2025 | Unit |
|---|---|---|---|
| Palay output [1] | 19.09 | 19.67 | million metric tons |
| Grain yield [1] | 4.11 | 4.14 | t/ha |
| Average production cost [2, 3] | 14.52 | 13.26 | ₱/kg |
| Average net return [2, 3] | 36,211 | 18,476 | ₱/ha |
Reported estimates, rounded as published. Sources [1–3] and dates appear below. Palay is unmilled rice. The figures apply to the Philippines as a whole.
A larger national harvest can hide a difficult season
Palay is a useful lens on Philippine crop productivity because its harvested area, output and yield are reported separately. In its January 2026 annual release, PSA estimated that farmers harvested 19.67 million metric tons of palay in 2025, up from 19.09 million in 2024. Harvested area expanded by 2.2%, while average yield rose by 0.8%. The larger harvest therefore reflects both more area harvested and a modest gain per hectare. Harvested area counts repeated harvests from the same land.
Season matters. Fourth-quarter output moved in the opposite direction, declining 5.2% year on year. A producer choosing a variety, timing a fertilizer purchase or hiring a harvester experiences a particular season. A national annual average smooths those differences. It also combines irrigated and rainfed farms with different degrees of control over planting dates and water supply.
The word crop covers more than grain yield. In onion, the saleable fraction and storage losses influence income. In mango, grading and the timing of harvest affect what can be sold. For a corn grower selling dried grain, moisture and drying charges enter the calculation. A rice statistic can illustrate a budgeting method, but its value cannot be transferred to those enterprises.
Read the margin as carefully as the yield
For Philippine palay, PSA estimated 2025 average production cost at ₱55,097 per hectare and average net return at ₱18,476 per hectare. Compared with the separately published 2024 estimates, both the unit cost and the net return declined. This qualifies the rising-cost premise in the title. A cheaper kilogram to produce can coincide with a much smaller return to the grower. A change in total production cost alone does not establish whether fertilizer prices rose on a particular farm.
National survey-based estimates include more than the cash a farmer hands over at planting. Inputs, labor, land arrangements and the value of the harvested crop all enter the farm account in different ways. PSA updates cost estimates using the input structure from its 2022 benchmark survey and relevant indicators. Use the table as a reference year and geographic benchmark. Actual invoices, harvest receipts and hired-labor records are better inputs for a decision on next season’s spending.
A practical break-even test starts before the trial. For illustration only, suppose a change costs an additional ₱1,500 per hectare including application labor, and the farmer expects ₱20 per kilogram of saleable grain. With all other costs unchanged, the additional yield needed to cover the change is 75 kilograms per hectare. If drying or hauling expands with the harvest, use the net price after those variable costs. If the grain price falls, more extra grain is needed. Neither figure is a product price or a forecast.
Trace uneven growth back to the field
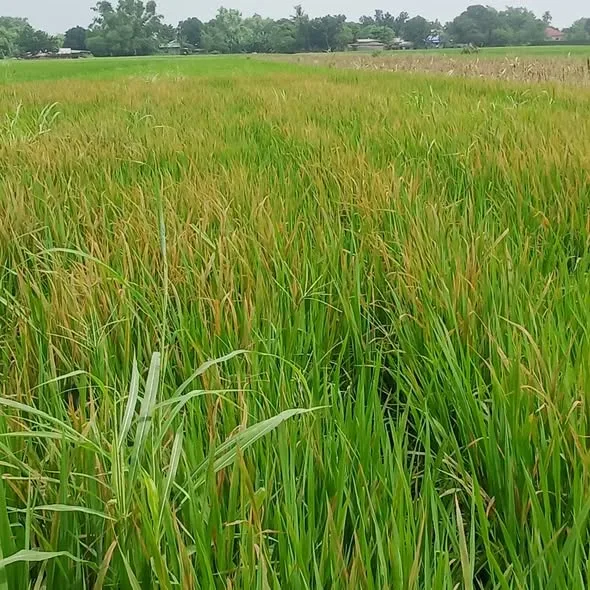
Begin where two parts of the field diverge. Walk the boundary between a vigorous patch and a stunted patch. Record the irrigation route, slope, standing water, plant density and changes in soil texture. Note when symptoms appeared relative to planting, fertilizer application, heavy rain or irrigation interruption. A color photograph with a date, crop stage and location is more informative than a close-up of an unidentified yellow leaf.
A nutrient shortage, prolonged saturation, damaged roots and weed competition can all leave a crop pale or uneven. Inspect the root system of a representative plant on either side of the boundary and discuss sampling with a local agricultural technician. A soil sample that mixes a small damaged patch with an otherwise vigorous field may conceal the difference being investigated. Keep those zones distinct when collecting samples for diagnosis.
Soil degradation is a change over time. One harvest cannot establish a decline in soil organic matter. Compare soil tests collected at similar depths, locations and times of year, and record what was returned or removed after harvest. In upland corn and hillside gardens, document visible runoff and exposed soil after storms. In an irrigated paddy, record how quickly the field drains and whether plants establish evenly. Those observations direct attention to different management decisions.
Match the nutrient plan to the limiting condition
In rice, PhilRice offers a leaf color chart to help assess nitrogen status and a Minus-One Element Technique kit to diagnose nutrient limitations before planting. These tools answer different questions. A leaf reading gives an indication of crop nitrogen status at the time of observation. A soil nutrient assessment can help plan which nutrients may be limiting before the next crop is established. Follow the guidance for the particular tool and variety.
When water supply, weeds or root injury already restrict growth, putting more fertilizer into the field may fail to recover the lost yield. A more informative investment may be repairing an irrigation inlet, leveling a poorly served patch or improving timely weed control. Record labor as well as purchased inputs. A practice that saves one bag of fertilizer but requires repeated hired work may deliver little net saving.
For perennial crops, follow several cycles of flowering and harvest before interpreting a large crop as a treatment response. In short-cycle vegetables, keep separate records of marketable and rejected produce. Both examples illustrate the same rule: choose the measure that predicts the farmer’s return, and decide how it will be collected before comparing practices.
What the Philippine field evidence supports
The rhizosphere is the part of the soil influenced by living roots. Microorganisms participate in decomposition and nutrient cycling there. Some bacteria associate with roots, while compatible mycorrhizal fungi develop threads that extend a plant’s reach into the soil. Whether an inoculant produces a useful response depends on the crop, formulation, field conditions and existing nutrient supply. A biological mechanism gives a reason to test a product. It cannot supply an expected peso return by itself.
A Philippine field experiment by Banayo and colleagues tested three biofertilizers in irrigated lowland rice across four cropping seasons. Responses varied by season and formulation. Most absolute increases were below half a metric ton of grain per hectare, and one season lacked a statistically significant increase. The experiment provides evidence that responses can occur and that variability is material. It did not test the AA Biotek products featured in this site.
These results are specific to the study setting. A result from irrigated lowland rice does not by itself establish a response in drought-stressed corn, a mango orchard or a vegetable bed. Product identity and intended use, an appropriate comparison and local harvest results are necessary before a producer can assign a fertilizer replacement value or make a dependable savings claim.
Set up a comparison that can answer the decision
First write down the question. If the question is whether a biological input adds value at the present fertilizer rate, maintain that rate in both comparison areas. If the question is whether a lower fertilizer rate can work with a biological input, include the lower rate without that input as well as the farm’s usual practice. Otherwise the effects of using less fertilizer and adding the product are inseparable.
Use the same variety, sowing date, seed quality and harvesting method. Compare several matched strips, distribute treatments within those groups and keep a map. In a field that slopes from the irrigation canal, avoid assigning all of one treatment to the wetter end. Record relevant departures from the plan, including a missed irrigation or a pest outbreak, without discarding an inconvenient result.
Harvest comparable interior areas, measure their actual size and compare grain at the same moisture basis. For a vegetable crop, count rejected produce and record the price for each saleable grade. Keep track of the grower’s time, additional labor, transport and products. Calculate the difference in revenue minus the difference in cost. An improvement in early plant height can justify further observation. Harvest and cost records answer the investment question.
For AA Biotek, the next useful evidence would be independently reviewed, replicated results across more than one site or season, with formulation, management, harvest data and uncertainty reported together. The Crops & Garden division lists the TEK options available for a product-specific discussion. Ask for the current label and relevant evidence for your crop before planning a purchase.
Questions from the field
Does a bigger harvest always improve earnings?
Revenue depends on the marketable quantity and price. Subtract the full cost of producing and selling the crop. A higher yield may carry additional harvest, drying and labor costs.
Can a farm cut fertilizer by a fixed percentage?
A local nutrient assessment and a field comparison can establish whether a reduction maintains yield and return. An ingredient name or a national statistic is insufficient to set that percentage.
What should I bring to a consultation?
Bring the crop and variety, location, field size, water source, previous yield, fertilizer and labor costs, relevant soil results and dated photographs of both affected and healthy plants.
Sources
- Philippine Statistics Authority, Palay Situation Report, January–December 2025 (28 January 2026)
- Philippine Statistics Authority, 2025 Costs and Returns of Palay Production (15 July 2026)
- Philippine Statistics Authority, 2024 Costs and Returns of Palay Production (15 July 2025)
- Philippine Rice Research Institute, Diagnostic Tools (accessed 21 November 2026)
- Banayo, Sta. Cruz, Aguilar, Badayos & Haefele (2012). Evaluation of biofertilizers in irrigated rice. Agriculture 2, 73–86.
- Philippine Rice Research Institute, PalayCheck System, 2022 revised edition